Global satellite survey reveals uncertainty in landfill methane emissions
Article Date: 05 November 2025
Article URL: https://www.nature.com/articles/s41586-025-09683-8
Article Image:
Summary
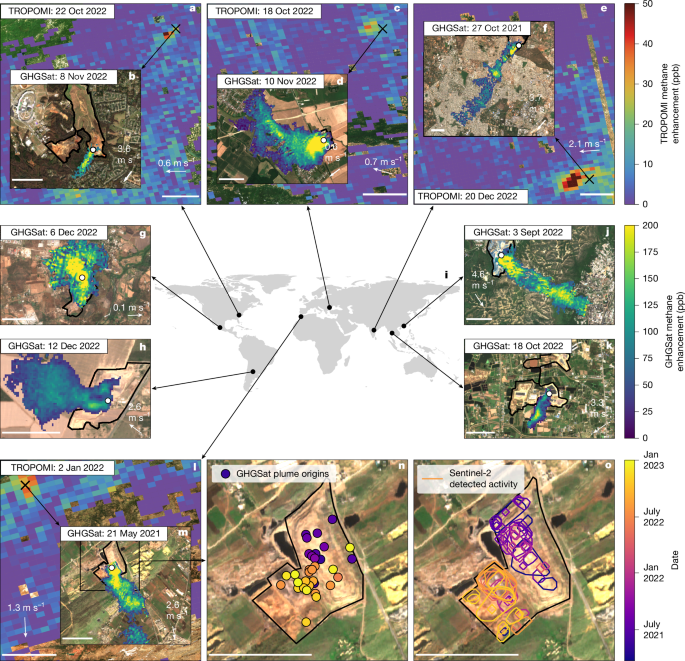
This study uses high-resolution satellite imagery (GHGSat) together with broader TROPOMI detections to survey methane emissions from 151 waste-disposal sites in 130 urban areas across six continents (1,447 clear-sky GHGSat observations in 2021–2022). The authors detect 1,085 methane plumes and derive site-average and per-plume emission rates using a calibrated mass-balance (IME) approach. Key findings include a heavy-tailed distribution of emissions (a minority of sites account for most emissions), significant discrepancies between satellite-derived (top-down) and modelled or reported (bottom-up) facility estimates, and identification of active landfill surfaces (work faces) as dominant emission sources within managed sites.
Key Points
- Global municipal waste has grown rapidly; ~70% currently goes to landfill/dumping where anaerobic decay produces methane, a potent short-lived greenhouse gas.
- GHGSat targeted 151 waste sites with 1,447 observations (2021–2022); 1,013 observations showed at least one detectable plume (1,085 plumes total).
- Median detected plume emission rate: 2.4 t h⁻¹; median site-averaged rate (including nulls): 1.2 t h⁻¹. Relative uncertainty of averages ~45%.
- Emissions are heavy-tailed: ~40% of sites account for ~80% of detected emissions — classic super-emitter behaviour.
- Managed landfills have significantly lower area-normalised emissions than informal dumping sites, emphasising the mitigation benefit of covering/closing modules.
- There is little to no correlation between satellite-derived emissions and national reporting or Climate TRACE model estimates — large scatter and site-level mismatches exist.
- High-resolution satellites can pinpoint plume origins and link them to active surface activity (work faces), enabling targeted mitigation by operators.
- If extrapolated, the 151 sites’ instantaneous satellite-scaled emissions correspond to ~2.8 Mt yr⁻¹ — ~7.4% of EDGAR 2022 solid-waste methane — but sample is biased toward higher emitters.
Content summary
The paper combines automated TROPOMI hotspot detection (daily, coarse resolution) with GHGSat targeted, high-resolution (~25 m) imaging to locate and quantify facility-scale methane plumes. The authors apply the Integrated Mass Enhancement (IME) mass-balance method (calibrated with LES and validated in controlled releases) to estimate emission rates and uncertainties. Recurrent satellite visits reveal temporal variability but no clear dependence on common meteorological drivers at the sampled sites. Using Sentinel-2 imagery, the study links many plume origins to recent surface activity on landfill work faces, showing where mitigation would be most effective. Comparison with bottom-up reporting and Climate TRACE models shows poor agreement, underlining gaps in current facility-scale inventories and the need for independent observations.
Context and relevance
Methane is responsible for a significant fraction of near-term warming, and solid-waste emissions are a meaningful share of anthropogenic methane. Rapid reductions in methane can slow warming quickly. This work demonstrates that satellites — particularly the growing high-resolution constellations — are powerful tools to find large emitters at landfills and dumping sites worldwide, to validate and improve bottom-up inventories, and to direct practical mitigation (covering, gas capture, diversion of organics). The mismatch between reported/modelled and satellite-measured emissions matters for national inventory accuracy, mitigation progress tracking and climate policy.
Author’s take
Punchy: this is an important, data-rich paper. It shows satellites don’t just map broad trends — they find the specific sites and surface areas causing big leaks. For policy-makers, landfill operators and emissions modellers this is eye-opening: many official methods miss the mark at facility scale. Coordinated on-site measurements, improved reporting methods and regular satellite monitoring are essential if we want to close the gap and deliver fast methane reductions.
Why should I read this?
Fancy a quick reality check on where methane from waste actually comes from? Read this. It cuts through model assumptions and shows, with satellite photos, where the real leaks are — and why dodgy inventories can give you the wrong picture. We’ve done the heavy lifting so you can see which sites and practices matter most for fast wins on emissions.