Estimation and mapping of the missing heritability of human phenotypes
Article Date: 12 November 2025
Article URL: https://www.nature.com/articles/s41586-025-09720-6
Article Image: Figure 1
Summary
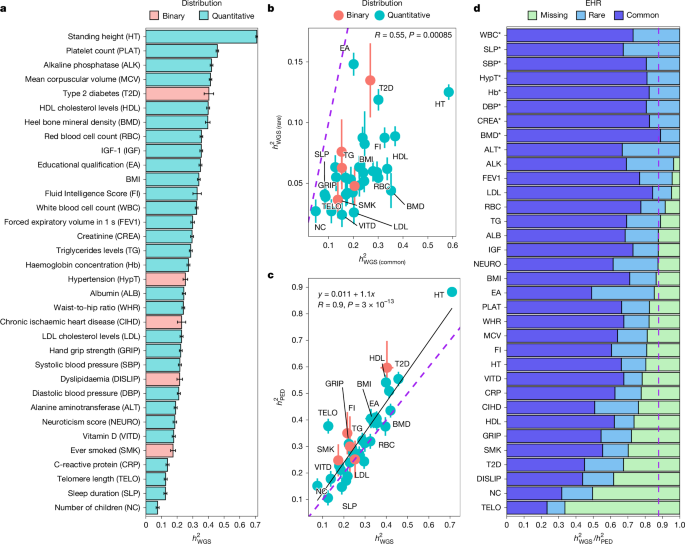
This Nature study uses whole‑genome sequencing (WGS) from UK Biobank to tackle the longstanding “missing heritability” problem. Analysing 347,630 unrelated European‑ancestry genomes (40.6M autosomal variants with MAF > 0.01%) and GWAS in 452,618 individuals, the authors estimate WGS-based SNP heritability (h2_WGS) for 34 complex traits and compare it to pedigree-based heritability.
Key outcomes: mean h2_WGS ≈ 0.284 across traits; WGS variants explain on average ~88% of pedigree narrow‑sense heritability; coding variants contribute ~17% and non‑coding ~83% of h2_WGS; rare variants (0.01% < MAF < 1% and lower) account for ~22% of h2_WGS on average. GWAS on WGS data identified 12,129 independent associations (11,243 common and 886 rare), with substantial rare‑variant mapping for lipid traits and alkaline phosphatase.
Key Points
- WGS data in ~347k unrelated UKB Europeans recover about 88% of pedigree‑based additive heritability on average, narrowing the “still‑missing” gap.
- Coding variants are highly enriched for heritability (≈17% of h2_WGS while representing <1% of variants), but most heritability remains in non‑coding regions.
- Rare variants contribute a measurable share (mean rare‑variant h2 ≈ 0.063), with trait‑specific variability (educational attainment notably high).
- GWAS on 452,618 WGS genomes found 12,129 independent trait associations, including 886 rare‑variant associations (RVAs); many RVAs colocalise near known common‑variant loci.
- Lipid traits (LDL, HDL, triglycerides) show strong rare‑variant mapping: detected RVAs explain >30% of rare‑variant heritability for some lipid measures.
- Distance to nearest common‑variant association (DCCVA) predicts per‑SNP variance explained: RVAs nearer CVAs tend to have larger effects.
- Limitations include focus on European ancestries, variants with MAF > 0.01% (primary), autosomes only, and use of hg38 (missing ≈8% of sequence vs T2T).
- Remaining missing heritability (~12% on average) likely stems from ultra‑rare variants, structural variants poorly tagged by short‑read WGS, genome build gaps and potential non‑additive effects.
Content summary
Study design: authors analysed 490,542 WGS samples (UKB tranche), focusing GREML‑LDMS heritability estimation on 347,630 unrelated Europeans and performing GWAS on 452,618 Europeans (including relatives). They partitioned variants by MAF and LD and used multiple methods (GREML, Haseman–Elston, LD score regression where appropriate) with careful covariate adjustment including birthplace clusters to control fine‑scale stratification.
Heritability results: across 34 well‑powered phenotypes, h2_WGS ranged from ~0.075 (number of children) to ~0.709 (height). Rare variants contribute substantially for some traits; educational attainment had ~43% of its WGS heritability from rare variants. EHR (explained heritability ratio = h2_WGS / h2_PED) averaged 0.88, with many quantitative traits showing no significant difference between WGS and pedigree estimates.
GWAS and mapping: joint GWAS/joint‑conditional analyses produced 12,129 independent loci; RVAs were enriched near CVAs, and many RVAs fall within WES regions but important large‑effect non‑coding RVAs were outside WES coverage. For lipids and alkaline phosphatase, a meaningful fraction of rare‑variant heritability is already mappable at single loci and replicates in an independent cohort.
Functional insights: coding regions show very large per‑variant enrichment (fold enrichment much greater than their genomic proportion), but enrichment patterns differ between common and rare variants and across traits. Fine‑mapping benefits from WGS versus imputation, though imputation panels still capture many signals.
Context and relevance
This paper is an important empirical benchmark for how much heritability WGS captures and how much remains to be explained. It demonstrates that with ~half‑million WGS genomes we can map a non‑trivial portion of rare‑variant heritability at single loci — especially for molecular and lipid traits — and that WGS recovers the bulk of pedigree heritability for many traits. The findings affect study design choices (WGS vs imputation), polygenic score development (including rare variants may boost accuracy), and priorities for discovering structural and ultra‑rare variation and expanding non‑European WGS resources.
Why should I read this
Short answer: if you care about how much of trait variation genetics can actually explain — and whether investing in WGS is worth it — this paper is gold. It shows WGS in a large biobank practically closes the gap with pedigree estimates for many traits, maps real rare‑variant hits (especially for lipids), and tells you where the remaining mysteries probably sit (ultra‑rare variants, structural changes, genome gaps). Useful whether you plan cohorts, build predictors or interpret GWAS hits.
Author style
Punchy: the study is a heavyweight, methodical demonstration that large‑scale WGS moves the needle on missing heritability. If you work in human genetics, genomics or statistical genetics this is highly relevant — the details matter for design, fine‑mapping and interpreting what ‘‘missing’’ actually means.