The global hydrogen budget
Summary
This Nature paper provides the first comprehensive, bottom-up global budget for atmospheric molecular hydrogen (H2) covering trends from 1990–2020 and a detailed gridded budget for 2010–2020. The authors synthesise multiple datasets and models to estimate sources and sinks, quantify uncertainties, map spatial patterns and evaluate the climate consequences of rising atmospheric H2 now and under future Shared Socioeconomic Pathway (SSP) scenarios. Key findings: total mean sources ≈ 69.9 ± 9.4 Tg H2 yr−1 and sinks ≈ 68.4 ± 18.1 Tg H2 yr−1 (2010–2020); photochemical production (from CH4 and NMVOCs oxidation) is the largest source (~38.4 Tg yr−1) and soil microbial uptake is the dominant sink (~50.0 Tg yr−1). Atmospheric H2 rose modestly (523.4 ppb in 1992 → 543.5 ppb in 2020; ~3.8%) and contributed ~0.020 ± 0.006 °C to global surface air temperature since preindustrial times. The paper flags large remaining uncertainties — especially soil uptake and H2 leakage — and shows future climate impacts depend critically on leakage rates and methane trajectories.
Key Points
- Total global H2 sources (2010–2020): 69.9 ± 9.4 Tg H2 yr−1; sinks: 68.4 ± 18.1 Tg H2 yr−1.
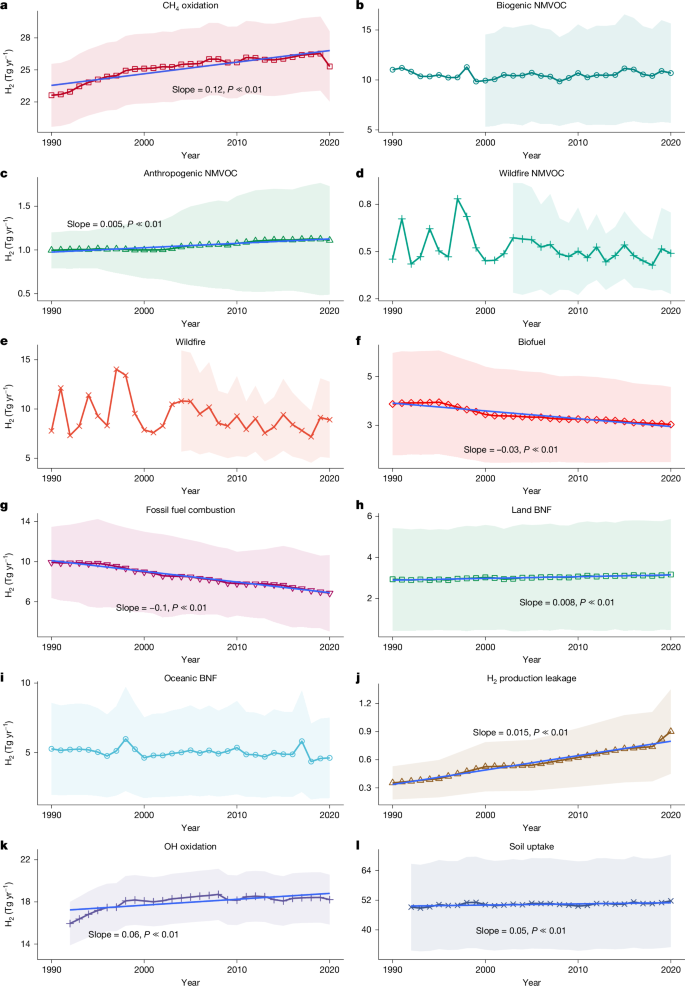
- Photochemical production (mainly CH4 oxidation + NMVOCs) is the single largest source (~38.4 Tg yr−1).
- Soil microbial uptake is the largest sink (~50.0 Tg yr−1) and the main contributor to budget uncertainty.
- Atmospheric H2 increased again after 2010; the rise is linked mainly to increased CH4 and NMVOC oxidation and some industrial leakage.
- Estimated leakage from industrial H2 production (2010–2020) ~0.7 ± 0.4 Tg yr−1 (assumed 1 ± 0.5% leakage rate at production sites).
- Regional patterns: tropical regions dominate both sources (~60%) and sinks (~50%); hotspots of emissions in Southeast and East Asia; Africa and South America are major regional sources and sinks on land.
- Climate impact: rising H2 contributed ~0.020 ± 0.006 °C historically; future impact depends on H2 use and leakage and CH4 trajectories — projected missing warming in current climate models of ~0.01–0.05 °C under typical SSPs, but much larger if high demand coincides with high leakage and unabated CH4.
- Data and measurement gaps: soil uptake parameterisation, empirical emission factors (many sectors), distributed leakage measurements, and portable H2 sensors for field and aerial monitoring.
Context and relevance
The paper matters because hydrogen is being promoted as a major low-carbon energy vector. This study shows that the climatic benefits of a hydrogen economy are not automatic: indirect effects of atmospheric H2 (via OH chemistry, methane lifetime and ozone/stratospheric water vapour) and leakage could meaningfully weaken net climate gains. The budget gives a baseline for future top-down inversions and transport models, and it identifies where targeted measurements (soil H2 uptake, leakage along the value chain, NMVOC yields) would most reduce uncertainty. For policy-makers and energy planners, the clear implication is that strict controls on leakage and coordinated methane mitigation are essential to ensure hydrogen’s climate advantage.
Author note (punchy)
Author style: Punchy — this is a high-impact, policy-relevant synthesis. If you care about whether hydrogen really delivers climate benefits (and you should), this paper tells you where the risks are and where the measurements and regulation need to happen.
Why should I read this?
Short answer: because hydrogen looks great on paper but can leak — and leaked H2 messes with methane and atmospheric chemistry so it can erode the climate wins. This study saves you the slog: the authors did the heavy lifting, mapped the budget, showed the hotspots and spelled out the big unknowns. Read it if you want to understand whether expanding H2 use is actually safe for the climate and what to watch for (spoiler: leakage and soil uptake).